What is the primary use for the water?
Drives size, depth, heating and whether a spa is the better project.
No votes yet. Yours will be the first. · saved on this device
Loading...
Pool Plan Compass · Statistics
138 sourced data points on pool and spa construction: what projects cost, what they return at resale, what homeowners choose, how many U.S. homes already have each feature by region, and 2 findings from Pool Plan Compass's own analysis of federal household data. Every number links to where it came from.
These comparisons were calculated by Pool Plan Compass from the Energy Information Administration's 2024 household survey microdata and the Census Bureau's new-housing tables. They answer questions the published reports don't break out.
Pool Plan Compass analysis · 2024
95% interval 65.6%–72.6% · about 6.3 million homes · 1,222 survey households
Most hot tubs sit on their own, not beside a pool. A stand-alone spa pad with its own electrical run is the common project, and it doesn't need to be priced as a pool package.
Source: Pool Plan Compass analysis of 2024 federal household survey data from the U.S. Energy Information Administration. How we calculated it
Pool Plan Compass analysis · 2024
95% interval 13.9%–16.1% · about 5.8 million homes · 5,384 survey households
95% interval 5.9%–7.5% · about 3.4 million homes · 6,581 survey households
Difference: 8.2 percentage points (95% interval 6.9 to 9.6).
Pool ownership rises sharply with household income, which is why resale value depends so much on the neighborhood. A pool adds more where comparable homes already have one.
Source: Pool Plan Compass analysis of 2024 federal household survey data from the U.S. Energy Information Administration. How we calculated it
$65,909 Typical U.S. inground pool costs $65,909, with most projects $44,499 to $87,349
Angi's cost guide, updated August 2026, is the benchmark behind this site's calculator. It is an inground pool reference, not a spa-only or water-feature price, and decking, barriers, excavation assumptions and landscaping must be confirmed in the proposal.
Angi, How Much Does It Cost to Install a Pool (2026)$41,835 Inground pools average $41,835; most projects run $25,002–$58,866
HomeAdvisor's 2026 cost guide puts in-ground pools at $44,300–$86,500 fully installed and $50–$125 per square foot. These figures exclude decking, fencing and landscaping, which can add tens of thousands.
HomeAdvisor, How Much Does It Cost to Build a Pool (2026)$65,000–$120,000 Gunite $65k–$120k, fiberglass $25k–$60k, vinyl $20k–$40k installed
HomeAdvisor's 2026 material breakdown shows concrete costs two to three times a vinyl-liner pool up front. Concrete buys unlimited shape freedom; fiberglass and vinyl buy lower cost and faster installation.
HomeAdvisor, How Much Does It Cost to Build a Pool (2026)$2,000–$35,000 Adding a hot tub or spa to a new pool project costs $2,000–$35,000
HomeAdvisor lists the attached spa as one of the widest-ranging add-ons, alongside heaters at $1,800–$4,000 and covers at $800–$2,600. A raised spillover spa built in gunite sits at the top of that range.
HomeAdvisor, How Much Does It Cost to Build a Pool (2026)$74,000–$113,000 Fiberglass pools average about $74k (under 26 ft) to $113k (35 ft+); vinyl $35k–$80k, gunite $50k–$120k+
Thursday Pools' 2026 guide, updated July 30, 2026, prices fiberglass by shell size: about $74,000 small, $109,000 medium (27–34 ft) and $113,000 large. Thursday is a fiberglass manufacturer. It also lists fencing at $10–$45 per linear foot and automatic covers at $8,000–$20,000.
Thursday Pools, How Much Does an Inground Pool Cost in 2026?$8,000–$20,000 Automatic pool covers cost $8,000–$20,000 installed; manual covers $1,500–$6,000
Thursday Pools' 2026 guide prices winter covers at $75–$250, manual retractable covers at $1,500–$6,000 and automatic covers at $8,000–$20,000. River Pools' fiberglass guide quotes automatic covers at $14,000–$21,000.
Thursday Pools, How Much Does an Inground Pool Cost in 2026?$60,000–$100,000 Basic fiberglass install $60k–$100k; with patio $85k–$135k; turn-key $85k–$200k
River Pools' fiberglass pricing guide (updated December 8, 2025) defines a basic install as shell, delivery, pump and filter, permit, excavation, backfill, fill water and rough grading, excluding electrical and patio. Adding a 400–800 sq ft concrete patio gives $85,000–$135,000; a full turn-key job runs $85,000–$200,000. River Pools builds fiberglass pools.
River Pools and Spas, How Much Will My Fiberglass Pool Really Cost? (2025)$180–$350 per sq ft Whole inground pool projects run $180–$350 per sq ft of pool; a 12x24 pool costs $38k–$100k
This Old House's guide (updated June 6, 2025) divides total project cost by pool area: vinyl $130–$240, fiberglass $175–$330 and concrete $200–$350 per sq ft. That includes fixed costs such as equipment, permits and mobilization, which is why it runs well above pool-only per-foot rates.
This Old House, How Much Does an Inground Pool Cost? (2025)$20,000+ vs $5,750 Ten-year upkeep: about $20,000+ for gunite vs about $5,750 for fiberglass (fiberglass-maker estimate)
Thursday Pools, a fiberglass manufacturer, puts both shells at $45,000–$65,000 upfront in its gunite-versus-fiberglass comparison, then estimates ten-year maintenance at about $20,000 or more for gunite and $5,750 for fiberglass, with 4–5 weekly maintenance hours versus an hour or less.
Thursday Pools, Gunite Pool vs Fiberglass Pool (2026)$95,000–$225,000 Full concrete pool packages run $95k–$225k; fiberglass $85k–$200k
River Pools' December 2025 guide prices complete installation packages and notes homeowners typically budget another $25,000–$50,000 for electrical, patios, fencing and accessories. These full-package figures sit well above bare-pool cost guides.
River Pools and Spas, Inground Pool Cost Guide (2025)$59,000–$140,000 Inground pools run $59,000–$140,000 in California vs $34,800–$72,000 in Arizona
Today's Homeowner's 2026 state ranges also list Florida at $38,200–$101,328 and Texas at $51,900–$100,700. Local labor rates, soil conditions and permit rules drive large regional swings for the same pool.
Today's Homeowner, How Much Does an Inground Pool Cost (2026)$3,594–$10,782 Auto covers add $3,594–$10,782; saltwater $1,008–$2,620; infinity edge $20,000+
Fixr's swimming pool cost guide (national average $44,688) itemizes popular add-ons, including lighting at $1,000–$2,000 and diving boards at $570–$6,022. An infinity or vanishing edge adds $20,000–$26,000 or more.
Fixr, Swimming Pool Cost (2024)$450–$5,000 Pool water features such as waterfalls and fountains cost $450–$5,000 to add
Bob Vila's 2026 pool remodeling guide prices water features alongside LED lighting at $450–$1,700 and slides at $1,000–$15,000. Sheer descents and bubblers sit at the low end; custom rock waterfalls and grottos run far higher.
Bob Vila, Pool Remodel Cost (2026)$15,000 An in-ground hot tub averages $15,000 installed, typically $5,000–$25,000
HomeAdvisor's 2026 guide notes custom units can exceed $35,000, excavation runs about $2,000 and electrical wiring $600–$2,200. Prefabricated shells save roughly $2,000–$3,000 versus custom.
HomeAdvisor, In-Ground Hot Tub Cost (2026)$6,000 A new hot tub averages $6,000 installed; typical range $2,000–$11,000
HomeAdvisor's 2026 tiering runs entry-level $2,500–$5,000, value $5,000–$8,000, premium $8,000–$11,000 and luxury $11,000+. Expect $20–$30 a month in electricity and $500–$1,000 a year in maintenance.
HomeAdvisor, Hot Tub Prices (2026)$2,300 Hot tub install labor averages $2,300; wiring $600–$2,200, crane $800–$1,500
HomeAdvisor's 2026 installation guide adds a new subpanel at $400–$1,800, a concrete pad at $2–$6 per sq ft for 100–120 sq ft, and permits at $100–$250. Site access and electrical capacity drive most of the install variance.
HomeAdvisor, Hot Tub Installation Cost (2026)$15,000–$40,000 Swim spa combos cost $15,000–$40,000; in-ground hot tubs $15,000–$20,000
Fixr's 2025 hot tub guide puts the national average at $6,900 ($4,000–$8,500), with operating costs of $25–$50 a month and a lifespan of 5–20 years depending on build quality. Swim spas are the priciest category short of a full pool.
Fixr, Hot Tub Installation Cost (2025)$6–$18+ per sq ft Concrete pool decks cost $6–$18+ per sq ft, or $5,400–$16,200 for 900 sq ft
Concrete Network prices simple broom-finish decks at $6–$11, custom stamped or stained at $11–$18, and elaborate designs at $18+ per sq ft. Stone pavers run $12–$45 per sq ft installed by comparison.
Concrete Network, Concrete Pool Deck Cost (2026)$10–$50+ per sq ft Pool patios run $10–$15 per sq ft for basic concrete, $20–$50+ for luxury stone
River Pools' 2025 guide separates patio from the pool package because material choice can swing the surround cost by 3–5x. Travertine, pavers and natural stone sit at the top of the range.
River Pools and Spas, How Much Do Inground Pools Cost in 2025$6,500 Pool safety fences average $6,500 installed; barriers must be at least 48 in
Fixr's 2025 guide prices mesh at $7–$10, aluminum $15–$35 and frameless glass $150–$210 per linear foot installed, and notes some jurisdictions require 60-inch barriers. Fencing is usually a code requirement, not an option, for a new pool.
Fixr, Pool Fence Cost (2025)$25,000 A saltwater pool averages $25,000; converting an existing pool costs $500–$2,500
HomeAdvisor's 2026 guide says a 20,000 gallon pool needs 10–12 forty-pound bags of salt ($100–$300) and the chlorinator adds about $50 a year in electricity. Saltwater is a popular new-build spec for softer water and lower chemical bills.
HomeAdvisor, Saltwater Pool Cost (2026)47.7% Pool homes using the pool in all 12 months (2024)
47.7% of homes with a swimming pool in 2024 (about 4.6M housing units); by region: South 63.2%, West 76.9%. Our weighted analysis of EIA 2024 RECS preliminary household microdata (May 2026).
Pool Plan Compass analysis of EIA 2024 RECS preliminary household microdata (May 2026)35.8% Pool homes with a reported heating fuel (2024)
35.8% of homes with a swimming pool in 2024 (about 3.4M housing units); by region: Northeast 31.8%, South 32.0%, West 49.6%. Our weighted analysis of EIA 2024 RECS preliminary household microdata (May 2026).
Pool Plan Compass analysis of EIA 2024 RECS preliminary household microdata (May 2026)41.9% Pool homes using the pool in 1 to 6 months (2024)
41.9% of homes with a swimming pool in 2024 (about 4.0M housing units); by region: Northeast 94.9%, Midwest 89.2%, South 23.2%. Our weighted analysis of EIA 2024 RECS preliminary household microdata (May 2026).
Pool Plan Compass analysis of EIA 2024 RECS preliminary household microdata (May 2026)13.3% Pool homes using electric pool heating (2024)
13.3% of homes with a swimming pool in 2024 (about 1.3M housing units); by region: South 16.3%. Our weighted analysis of EIA 2024 RECS preliminary household microdata (May 2026).
Pool Plan Compass analysis of EIA 2024 RECS preliminary household microdata (May 2026)7.25% of occupied U.S. homes have a swimming pool (about 9.6 million households)
EIA's 2024 survey estimates 9,604,000 occupied primary residences with a pool. This is installed stock, not annual purchases; new construction runs about 60,000 pools a year by Pool Corporation's estimate.
EIA 2024 Residential Energy Consumption Survey (preliminary microdata, May 2026)7.61% of occupied U.S. homes have a hot tub (about 10.1 million households)
EIA's 2024 survey counts 10,084,000 hot-tub homes, slightly more than pool homes. Installed stock, not sales; the standalone spa is a mainstream purchase rather than a pool accessory.
EIA 2024 Residential Energy Consumption Survey (preliminary microdata, May 2026)2.1% of occupied U.S. homes have both a swimming pool and a hot tub
About 2,836,000 households own both, per EIA's 2024 survey. Most pool owners do not have a spa and most spa owners do not have a pool, which is a reason to decide the primary use before pricing an attached spa.
EIA 2024 Residential Energy Consumption Survey (preliminary microdata, May 2026)24.4% Record 24.4% of U.S. listings (333,000 homes) had a pool in April 2025
Realtor.com reported the share of for-sale listings with a pool hit an all-time high in April 2025. Pools have become a mainstream listing feature rather than a niche luxury, which matters when you weigh long-term resale.
Realtor.com / PR Newswire, Pool Premium report (2025)61,000 About 61,000 new U.S. pools were built in 2024, down 15% and ~50% below the peak
Pool Corporation, the largest pool products distributor, gave the estimate on its Q4 2024 earnings call and expected 2025 units to be flat. Slower build volumes mean better contractor availability and more negotiating room for homeowners.
Pool Corporation Q4 2024 earnings call transcript (MarketBeat)Just under 60,000 new pools were built in 2025, a mid-single-digit decline
Pool Corporation's Q4 2025 call said 2026 guidance assumes construction stays near 60,000 units, and that Florida will soon be its largest installed-base market. New pool construction has stabilized at about half the 2021–2022 pace.
Pool Corporation Q4 2025 earnings call transcript (MarketBeat)34% vs 35% In Q4 2024, 34% of pool companies saw new-pool revenue rise and 35% saw it fall
PHTA's Quarterly Pulse Survey of 300+ businesses (fielded January 15–February 7, 2025) found new-construction revenue split evenly, while 78% of companies still expected growth over the next 12 months. Builders are hungry for work, which favors homeowners getting bids.
Pool & Hot Tub Alliance, Q4 2024 Pulse Survey44% vs 37% In Q3 2025, 44% of pool firms reported higher new-pool revenue; 37% lower
PHTA's Q3 2025 Pulse Survey found overall revenue up 1–5% but profit margins flat for builders, with 69% expecting growth over the next 12 months and 70% naming economic factors as their top challenge. Builders under margin pressure may be less willing to discount but more eager to book work.
Pool & Hot Tub Alliance, Q3 2025 Pulse Survey60.06% of U.S. pool homes report an unheated pool
EIA's 2024 survey finds 5,768,000 of 9.6 million pool homes report no heating fuel. In warm climates many owners skip the heater; in cold ones the unheated pool sits under a cover much of the year.
EIA 2024 Residential Energy Consumption Survey (preliminary microdata, May 2026)15.8% of U.S. pool homes heat the pool with natural gas; 13.26% with electricity
EIA's 2024 survey shows gas as the most common pool heating fuel nationally, with electricity, which includes heat pumps, close behind. Installed stock; new builds in the humid South increasingly favor heat pumps.
EIA 2024 Residential Energy Consumption Survey (preliminary microdata, May 2026)48.2% of U.S. pool homes report no variable-speed pump
EIA's 2024 survey finds 4,629,000 pool homes still on single or dual-speed pumps, an installed-base figure that reflects older pools. Since the 2021 DOE rule, nearly all new residential pumps sold are variable speed.
EIA 2024 Residential Energy Consumption Survey (preliminary microdata, May 2026)52.7% of U.S. hot-tub homes heat the tub with electricity
EIA's 2024 survey shows electric heating as the norm for spas, rising to 60% in the Northeast. A dedicated 240-volt circuit is the standard spa installation requirement.
EIA 2024 Residential Energy Consumption Survey (preliminary microdata, May 2026)$310 per year A pool pump can be a home's second-largest energy user at up to $310 a year
ENERGY STAR notes certified in-ground pumps use 20% less energy than the federal baseline and pay for themselves in under two years, and that running a filter 6 hours a day instead of 24 cuts pump energy use 75%. Spec a variable-speed pump when you build.
ENERGY STAR, Pool Pumps (2026)Up to 90% Variable-speed pumps cut pump energy up to 90%; DOE rules took effect July 2021
Pentair's DOE regulation page says the Dedicated Purpose Pool Pump rule effectively requires variable-speed for most residential pumps and cites DOE potential savings of about $550 a year in operating cost. With more than 8.5 million U.S. pools, this is now the default spec for new builds.
Pentair, Pool Pump DOE Standards (2021)$345–$735 per year Variable-speed pumps save about 65%, or $345–$735 a year, versus single-speed
Pool Goods' May 2026 modeling shows a medium 15,000–25,000 gallon pool dropping from about 4,800 kWh to 1,650 kWh a year, with a 1–3 year payback on the pump premium. Savings ranged from $477 in the Pacific Northwest to $1,743 in Hawaii on electricity rates alone.
Pool Goods, Variable Speed Pool Pump Energy Savings by Pool Size (2026)63.15% of Southern pool homes use the pool all 12 months
EIA's 2024 regional breakdown shows about 2.8 million Southern pool homes swimming year-round. Months of use is the best predictor of whether a pool feels worth its cost.
EIA 2024 Residential Energy Consumption Survey (preliminary microdata, May 2026)76.89% of Western pool homes use the pool all 12 months
The West has the highest year-round use rate in EIA's 2024 survey, about 1.7 million households, consistent with its mild winters and the highest share of heated pools.
EIA 2024 Residential Energy Consumption Survey (preliminary microdata, May 2026)94.88% of Northeastern pool homes use the pool 1 to 6 months a year
EIA's 2024 survey shows the Northeast's pool season is short: about 1.56 million of 1.64 million pool homes use the pool one to six months. Plan for closing, freeze protection and a winter cover.
EIA 2024 Residential Energy Consumption Survey (preliminary microdata, May 2026)4.4% of Midwestern homes have a pool, the lowest regional share
EIA's 2024 survey counts about 1.26 million Midwestern pool homes, and 89% of them use the pool one to six months. Vinyl and fiberglass shells are common for freeze tolerance and cost.
EIA 2024 Residential Energy Consumption Survey (preliminary microdata, May 2026)8.6% of Southern homes have a pool, about 4.4 million households
The South has the most pools in absolute terms per EIA's 2024 survey. Summer storms and high water tables make deck drainage and hydrostatic relief design items there.
EIA 2024 Residential Energy Consumption Survey (preliminary microdata, May 2026)49.6% of Western pool homes report a pool heating fuel, the highest regional share
Roughly half of Western pool homes heat, with natural gas at 28%, per EIA's 2024 survey. Dry air also makes the West the region where evaporation from water features costs the most.
EIA 2024 Residential Energy Consumption Survey (preliminary microdata, May 2026)10.5% of Western homes have a hot tub, the highest regional share
About 3.1 million Western households own a hot tub per EIA's 2024 survey, against 5.7% in the Northeast and about 7% in the South and Midwest. Installed stock, not sales.
EIA 2024 Residential Energy Consumption Survey (preliminary microdata, May 2026)42.2% of Northeastern hot-tub homes use the tub all 12 months, the highest regional rate
EIA's 2024 survey shows the Northeast leads on year-round spa use even as its pool use is overwhelmingly seasonal. In a cold climate the hot tub is the water feature that gets used in January.
EIA 2024 Residential Energy Consumption Survey (preliminary microdata, May 2026)61.8% In Miami 61.8% of listings have a pool; Phoenix 58.4%, Orlando 55.3%
Realtor.com's 2025 metro breakdown shows pools are the norm in Sun Belt markets. In these metros a home without a pool can be the outlier, which changes the resale math compared with northern markets.
Realtor.com / PR Newswire, Pool Premium report (2025)30.0% of U.S. hot-tub homes use the tub all 12 months
EIA's 2024 survey finds fewer than a third of hot-tub homes soak year-round nationally, though the Northeast reaches 42%. A tub kept hot but unused still costs money to run.
EIA 2024 Residential Energy Consumption Survey (preliminary microdata, May 2026)71% of surveyed homeowners who hired a pro prioritized preventative maintenance
Angi's April 2025 pulse survey found preventative maintenance a top priority among homeowners who hired a professional. For pools that means deck joint sealant, cover care and pump scheduling.
Angi 2025 State of Home Spending Pulse Report54% of surveyed Houzz homeowners renovated in 2025; 50% plan to in 2026
The 2026 U.S. Houzz & Home Study is a platform sample of Houzz users, not all households, and intent is not completed work. It shows sustained renovation activity among engaged homeowners.
2026 U.S. Houzz & Home Study69.1% of hot-tub homes report no swimming pool (2024)
Our weighted analysis of the EIA's 2024 household survey microdata: Hot-tub homes with a yes/no pool response: share reporting no pool 69.1%. A combined pool-and-spa package does not describe every existing hot-tub household.
Pool Plan Compass analysis of EIA 2024 RECS household data8.2 pts gap in pool ownership: owners earning $100k+ (15.0%) vs under $100k (6.7%)
Our weighted analysis of the EIA's 2024 household survey microdata: Owner households with income of $100,000 or more 15.0% versus Owner households with income below $100,000 6.7% (a 8.2-point gap). An ownership association does not estimate incremental buyers or establish a cause.
Pool Plan Compass analysis of EIA 2024 RECS household data52% Decorated in 2025 (Houzz 2026 study)
The 2026 U.S. Houzz & Home Study surveyed homeowners on Houzz about their 2025 projects and 2026 plans; 52% decorated in 2025, alongside 54% who renovated and 47% who made repairs.
2026 U.S. Houzz & Home Study47% Repaired in 2025 (Houzz 2026 study)
The 2026 U.S. Houzz & Home Study surveyed homeowners on Houzz about their 2025 projects and 2026 plans; 47% made repairs in 2025, while 54% renovated and 52% decorated.
2026 U.S. Houzz & Home Study50% of surveyed Houzz homeowners plan to renovate in 2026
The 2026 U.S. Houzz & Home Study found 54% of surveyed homeowners renovated in 2025 and 50% plan to renovate in 2026. Stated intent, from a Houzz platform sample.
2026 U.S. Houzz & Home Study29% Bundled repairs (Angi, April 2025)
Angi's 2025 Home Spending Pulse surveyed homeowners who had hired a pro in the previous year (fielded April 15–16, 2025). 29% bundled several repairs into one visit.
Angi 2025 Home Spending Pulse19% Selected cheaper materials/services (Angi, April 2025)
Angi's 2025 Home Spending Pulse surveyed homeowners who had hired a pro in the previous year (fielded April 15–16, 2025). 19% chose cheaper materials or services.
Angi 2025 Home Spending Pulse23% Started early before price rises (Angi, April 2025)
Angi's 2025 Home Spending Pulse surveyed homeowners who had hired a pro in the previous year (fielded April 15–16, 2025). 23% started a project early before expected price rises.
Angi 2025 Home Spending Pulse62% Increased maintenance-affordability concern (Angi, April 2025)
Angi's 2025 Home Spending Pulse surveyed homeowners who had hired a pro in the previous year (fielded April 15–16, 2025). 62% reported growing concern about affording home maintenance.
Angi 2025 Home Spending Pulse54% Homes listed with a pool carry a 54% price premium over homes without
Realtor.com's April 2025 analysis found the median list price of a home with a pool was $599,000 versus $389,000 without one. The gap reflects the larger, better-located homes that tend to have pools, not just the pool itself, but it shows buyers still pay up for pool homes.
Realtor.com / PR Newswire, Pool Premium report (2025)5–8% A pool adds about 5–8% to home value nationally, 10–15%+ in the Sun Belt
Opendoor's May 2026 analysis, citing Zillow data, puts the isolated national pool premium at 5–8% (about $20,000–$32,000 on a $400,000 home), rising to 10–15% or more in Florida, Arizona, Texas, California and Nevada. Expect only partial cost recovery outside warm climates.
Opendoor, Does a Pool Add Value to Your Home (2026)40–60% Homeowners typically recoup 40–60% of an inground pool's cost at resale
Opendoor estimates a $60,000 inground pool usually adds $24,000–$36,000 in value. A pool is a lifestyle purchase first and an investment second, so build it for years of use rather than a quick flip.
Opendoor, Does a Pool Add Value to Your Home (2026)2–6 weeks Permits take 2–6 weeks; a full pool build runs 2–3 months to first swim
HomeAdvisor's timeline allots two to six weeks for permitting, about a week for excavation, and one to two months for construction, plumbing and electrical. Start paperwork in late winter if you want to swim by midsummer.
HomeAdvisor, How Much Does It Cost to Build a Pool (2026)2–6 weeks vs 3–6 months Fiberglass pools install in 2–6+ weeks; concrete pools take 3–6+ months
River Pools' 2025 cost guide contrasts the factory-built fiberglass shell with the multi-stage shotcrete, cure, plaster process of concrete. Timeline is often a deciding factor for families who want to swim the same season.
River Pools and Spas, How Much Do Inground Pools Cost in 2025$500–$2,000 Pool permits cost $500–$2,000 and add $50–$75 a year to homeowners insurance
Today's Homeowner's 2026 guide also estimates fiberglass installs at 3–4 weeks versus 8–12 weeks for gunite. Budget for permit fees and a modest insurance bump on top of the build price.
Today's Homeowner, How Much Does an Inground Pool Cost (2026)54 inches Pool gate latch releases commonly sit at least 54 in above grade; barriers at least 20 in from the water
A July 2026 ISPSC summary lists a 48-inch minimum barrier, no opening that passes a 4-inch sphere, self-closing and self-latching gates that swing away from the pool, a latch release commonly 54 inches above grade, no footholds within the first 45 inches, and at least 20 inches from the water's edge. Arizona and parts of California commonly require 60 inches.
Mister Baluster, Pool Fence and Barrier Code Requirements (2026)376 per year 376 children under 15 drowned in pools or spas each year from 2021 to 2023
CPSC's June 2026 report counted 379 fatal child drownings in 2023, up 6% from 359 in 2022, with nearly 80% of victims under age five and over 70% occurring in residential settings. Layered barriers, alarms and covers should be in the build plan from day one.
U.S. Consumer Product Safety Commission, 2026 drowning report release85% of fatal child pool and spa drownings happen at a residence
CPSC's 2025 report, summarized by Pool Safely, found 357 child fatalities a year from 2020 to 2022, with children aged 1–3 making up 68% of deaths and about 6,300 ER-treated nonfatal drownings a year from 2022 to 2024. The risk is concentrated at home, not at public pools.
CPSC Pool Safely, 2025 annual drowning report blog4,345 per year The U.S. averages 4,345 drowning deaths a year; it is the top killer of kids 1–4
CDC data for 2018–2021 puts the age-adjusted drowning rate at 1.31 per 100,000 and ranks drowning as the leading cause of death for children ages 1–4 and second for ages 5–14. Pool owners with young children should plan for fencing, alarms and swim lessons.
CDC, Drowning Data and Research (2024)$960–$1,800 per year Annual pool maintenance runs $960–$1,800; pump electricity up to $300 a year
HomeAdvisor's 2026 guide puts monthly service at $30–$260, seasonal opening or closing at $150–$300 each, and notes saltwater pools average only about $100 a year in salt and chemicals. Budget the ongoing cost before you commit to the build.
HomeAdvisor, Pool Maintenance Cost (2026)Homes with a swimming pool: 7.2% nationally. Highest in Florida (19.9%), Arizona (18.9%), Nevada (11.8%); lowest in Maryland (3%), Illinois (3.5%), Hawaii (3.6%).
Homes with a hot tub: 7.6% nationally. Highest in Washington (12.6%), Nevada (12.3%), Montana (12.2%); lowest in Kentucky (3.5%), Massachusetts (4.1%), New York (4.9%).
Pool Plan Compass calculated these state estimates from the Energy Information Administration's 2024 household survey microdata. EIA publishes the 2024 survey nationally and by region, not by state. Shares are weighted; a dash means the state sample was too small for a reliable estimate (fewer than 100 households, fewer than 10 yes answers, or a relative standard error above 30%). Source data.
| State | Homes with a swimming pool | Homes with a hot tub |
|---|---|---|
| United States | 7.2% | 7.6% |
| Alabama | 5% | 5.7% |
| Alaska | — | 11% |
| Arizona | 18.9% | 11.8% |
| Arkansas | — | — |
| California | 9.8% | 10.8% |
| Colorado | — | 7.1% |
| Connecticut | 9.8% | 5.9% |
| Delaware | — | 9.1% |
| District of Columbia | — | — |
| Florida | 19.9% | 10% |
| Georgia | 6% | 5.8% |
| Hawaii | 3.6% | — |
| Idaho | — | 9.4% |
| Illinois | 3.5% | 9% |
| Indiana | 5.6% | 5.9% |
| Iowa | — | 5.7% |
| Kansas | — | 7.1% |
| Kentucky | 9.4% | 3.5% |
| Louisiana | 9.5% | 6.5% |
| Maine | 5.1% | 5.6% |
| Maryland | 3% | 8.6% |
| Massachusetts | 5.8% | 4.1% |
| Michigan | 5.2% | 6.5% |
| Minnesota | — | 8.7% |
| Mississippi | 5.3% | 6.5% |
| Missouri | — | 6% |
| Montana | — | 12.2% |
| Nebraska | — | 6.3% |
| Nevada | 11.8% | 12.3% |
| New Hampshire | 8.3% | 7.1% |
| New Jersey | 8.4% | 7.9% |
| New Mexico | — | 6.5% |
| New York | 7.2% | 4.9% |
| North Carolina | 4.7% | 5.5% |
| North Dakota | — | 8.2% |
| Ohio | 7.6% | 6.7% |
| Oklahoma | 7.3% | 8.6% |
| Oregon | — | 9.9% |
| Pennsylvania | 6.2% | 5.8% |
| Rhode Island | 8.7% | 5.8% |
| South Carolina | 7.4% | 8.2% |
| South Dakota | — | 8.6% |
| Tennessee | 6.8% | 6.9% |
| Texas | 8.1% | 7.1% |
| Utah | — | 11.7% |
| Vermont | 8% | — |
| Virginia | — | 5.8% |
| Washington | — | 12.6% |
| West Virginia | — | — |
| Wisconsin | — | — |
| Wyoming | — | 9% |
How many existing homes already have the features that shape a pool and spa construction project, nationally and in each census region. Pool Plan Compass weighted these from the federal survey records; counts are rounded.
| Measure | U.S. | Northeast | Midwest | South | West | Source |
|---|---|---|---|---|---|---|
| Homes with a swimming pool2024 · occupied primary-residence housing units | 7.2% | 7.2% | 4.4% | 8.6% | 7.6% | U.S. Energy Information Administration |
| Homes with a hot tub2024 · occupied primary-residence housing units | 7.6% | 5.7% | 7.1% | 7.1% | 10.5% | U.S. Energy Information Administration |
| Pool homes reporting a variable-speed pump2024 · homes with a swimming pool | 47.7% | 21.5% | — | 46.8% | 76.9% | U.S. Energy Information Administration |
| Pool homes reporting no variable-speed pump2024 · homes with a swimming pool | 48.2% | 73.4% | 61.8% | 50.0% | 18.8% | U.S. Energy Information Administration |
| Pool homes with a reported heating fuel2024 · homes with a swimming pool | 35.8% | 31.8% | — | 31.9% | 49.6% | U.S. Energy Information Administration |
| Pool homes reporting an unheated pool2024 · homes with a swimming pool | 60.1% | 63.1% | 64.3% | 64.8% | 46.1% | U.S. Energy Information Administration |
| Pool homes using the pool in all 12 months2024 · homes with a swimming pool | 47.7% | — | — | 63.2% | 76.9% | U.S. Energy Information Administration |
| Pool homes using the pool in 1 to 6 months2024 · homes with a swimming pool | 41.9% | 94.8% | 89.2% | 23.2% | — | U.S. Energy Information Administration |
| Hot-tub homes using the tub in all 12 months2024 · homes with a hot tub | 30.0% | 42.2% | 29.0% | 22.9% | 33.7% | U.S. Energy Information Administration |
| Hot-tub homes using electricity to heat the tub2024 · homes with a hot tub | 52.7% | 60.1% | 56.4% | 50.1% | 50.2% | U.S. Energy Information Administration |
| Homes with both a swimming pool and a hot tub2024 · occupied primary-residence housing units | 2.1% | 1.1% | — | 2.4% | 3.7% | U.S. Energy Information Administration |
| Pool homes using electric pool heating2024 · homes with a swimming pool | 13.3% | — | — | 16.3% | — | U.S. Energy Information Administration |
| Pool homes using natural-gas pool heating2024 · homes with a swimming pool | 15.8% | — | — | 11.6% | 27.7% | U.S. Energy Information Administration |
Published figures come from Angi, EIA 2024 Residential Energy Consumption Survey, Angi 2025 State of Home Spending Pulse Report, 2026 U.S. Houzz & Home Study, Realtor.com / PR Newswire, Opendoor, HomeAdvisor, Thursday Pools and other named sources, each linked where it appears. Housing data by region is Pool Plan Compass's weighted tabulation of the EIA's 2024 Residential Energy Consumption Survey public microdata, using the survey's own weights and 60 replicate weights for the intervals, and of the Census Bureau's Characteristics of New Housing tables. Figures describe the period and population shown next to each one.
Homeowner polls
Drives size, depth, heating and whether a spa is the better project.
No votes yet. Yours will be the first. · saved on this device
No votes yet. Yours will be the first. · saved on this device
No votes yet. Yours will be the first. · saved on this device
7.2% nationally in 2024 (about 9.6M housing units), based on Pool Plan Compass' weighted analysis of EIA 2024 RECS preliminary household microdata (May 2026). The share is highest in the South at 8.6% and lowest in the Midwest at 4.4%. The figure covers occupied primary-residence housing units.
7.6% nationally in 2024 (about 10.1M housing units), based on Pool Plan Compass' weighted analysis of EIA 2024 RECS preliminary household microdata (May 2026). The share is highest in the West at 10.5% and lowest in the Northeast at 5.7%. The figure covers occupied primary-residence housing units.
47.7% nationally in 2024 (about 4.6M housing units), based on Pool Plan Compass' weighted analysis of EIA 2024 RECS preliminary household microdata (May 2026). The share is highest in the West at 76.9% and lowest in the Northeast at 21.5%. The figure covers homes with a swimming pool.
48.2% nationally in 2024 (about 4.6M housing units), based on Pool Plan Compass' weighted analysis of EIA 2024 RECS preliminary household microdata (May 2026). The share is highest in the Northeast at 73.4% and lowest in the West at 18.8%. The figure covers homes with a swimming pool.
35.8% nationally in 2024 (about 3.4M housing units), based on Pool Plan Compass' weighted analysis of EIA 2024 RECS preliminary household microdata (May 2026). The share is highest in the West at 49.6% and lowest in the Northeast at 31.8%. The figure covers homes with a swimming pool.
Most hot tubs sit on their own, not beside a pool. A stand-alone spa pad with its own electrical run is the common project, and it doesn't need to be priced as a pool package. Pool Plan Compass calculated this from the federal government's 2024 household survey data: hot-tub homes with a yes/no pool response: share reporting no pool 69.1%.
Pool ownership rises sharply with household income, which is why resale value depends so much on the neighborhood. A pool adds more where comparable homes already have one. Pool Plan Compass calculated this from the federal government's 2024 household survey data: owner households with income of $100,000 or more 15.0% versus owner households with income below $100,000 6.7%.
$65,909. Angi's cost guide, updated August 2026, is the benchmark behind this site's calculator. It is an inground pool reference, not a spa-only or water-feature price, and decking, barriers, excavation assumptions and landscaping must be confirmed in the proposal. Source: Angi, How Much Does It Cost to Install a Pool (2026).
 Free toolInground pool cost calculator
Size, material tier and complexity in, a realistic budget range out.
 Free toolPool and spa comparisons, decided by your conditions
Side-by-side tables for the decisions that change the price most.
 Free toolPool planning quiz: nine things to know before the first site visit
9 questions that show what you already know and what to check next.
 Free toolPool planning polls
See what other planners chose and add your vote.
 Service guideCustom Pool Design & Build
Custom pool design and build covers everything from the site plan to first swim: excavation, the shell in gunite, fiberglass or vinyl, equipment and plumbing, electrical and bonding, the barrier, startup and training.
 Service guideSpa & Hot Tub Installation
Spa and hot tub installation covers the base, the delivery route, the dedicated electrical circuit with GFCI protection, drainage around the unit, and the cover and access arrangement that make it usable every week.
 Service guideWater Features & Waterfalls
Water features add sound and motion to a pool through sheer descents, bubblers, deck jets, scuppers, spillover spas or rock waterfalls.
 Service guidePool Decking & Coping
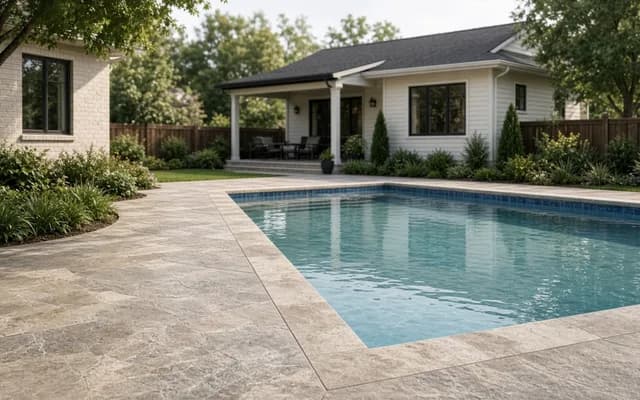
Pool decking and coping form the transition from water to yard: the coping caps the bond beam and the deck carries foot traffic and sheds water.
Tell us the size, the condition of what is there now, and what you want to change. Pool Plan Compass passes your request to independent local professionals, who reply with written, no-obligation estimates. The service is free to use.